Carbon Data Reliability
01 Intro
EcoVadis rates the sustainability of companies and their suppliers. Large companies (buyers) use those ratings to decide who they do business with; the suppliers being rated submit the underlying data. Carbon is one of the most important — and least trustworthy — parts of that data.
Most of a company's carbon footprint sits in its supply chain: Scope 3 (supply-chain) emissions are roughly 21× larger than a company's direct emissions. But suppliers mostly self-report this data with no verification, so buyers can't rely on it for compliance, procurement, or real decarbonization.
02 Problem
Make supplier-reported carbon data trustworthy enough to act on
Both buyers and suppliers relied on the same carbon numbers — and neither could trust them. But the manual analyst review ran just once a year — too slow to satisfy tightening climate regulations, or the buyers who depended on the data.
Uploaded their carbon data into a black box. They had no way to see how it was judged, or what would make one number more credible than another.
Received thousands of self-reported metrics with no way to tell third-party-audited data apart from a rough guess — so they couldn't act on any of it.
Reliability was only checked by analysts during annual assessments. That was far too slow for the compliance and procurement decisions buyers needed to make year-round.
03 Approach
Worked closely with my PM to pin down the exact problem we were solving and agree on how we'd know it worked — committing up front to measure the design with the UX-Lite metric rather than gut feel.
Proposed design directions and framed each as a clear hypothesis to validate, so usability testing would give us a real pass/fail instead of a debate about opinions.
Built a high-fidelity, interactive prototype using Figma variables and conditional prototyping — so it could handle different states and data points without rebuilding a screen for every path.
In the first round of usability testing, users completely ignored the option to upload documents in a batch. That revealed the real mental model: suppliers report carbon data one metric at a time, not in bulk. We pivoted to let them upload a document straight from a specific data point — and the next round tested clean, with users finding it easy.
Confirmed the design actually solved the problem with UX-Lite — rating two statements on a 5-point scale, "reporting carbon emission values was easy for me" and "…meets my needs" — instead of assuming a nicer interface meant a better outcome.
04 Solution
Carbon Data Reliability Levels attaches a trust tier — Low → Medium → High → 3rd-party verified — to every carbon metric across the network. To make that work at scale, the yearly analyst review became a fast, per-supplier loop:
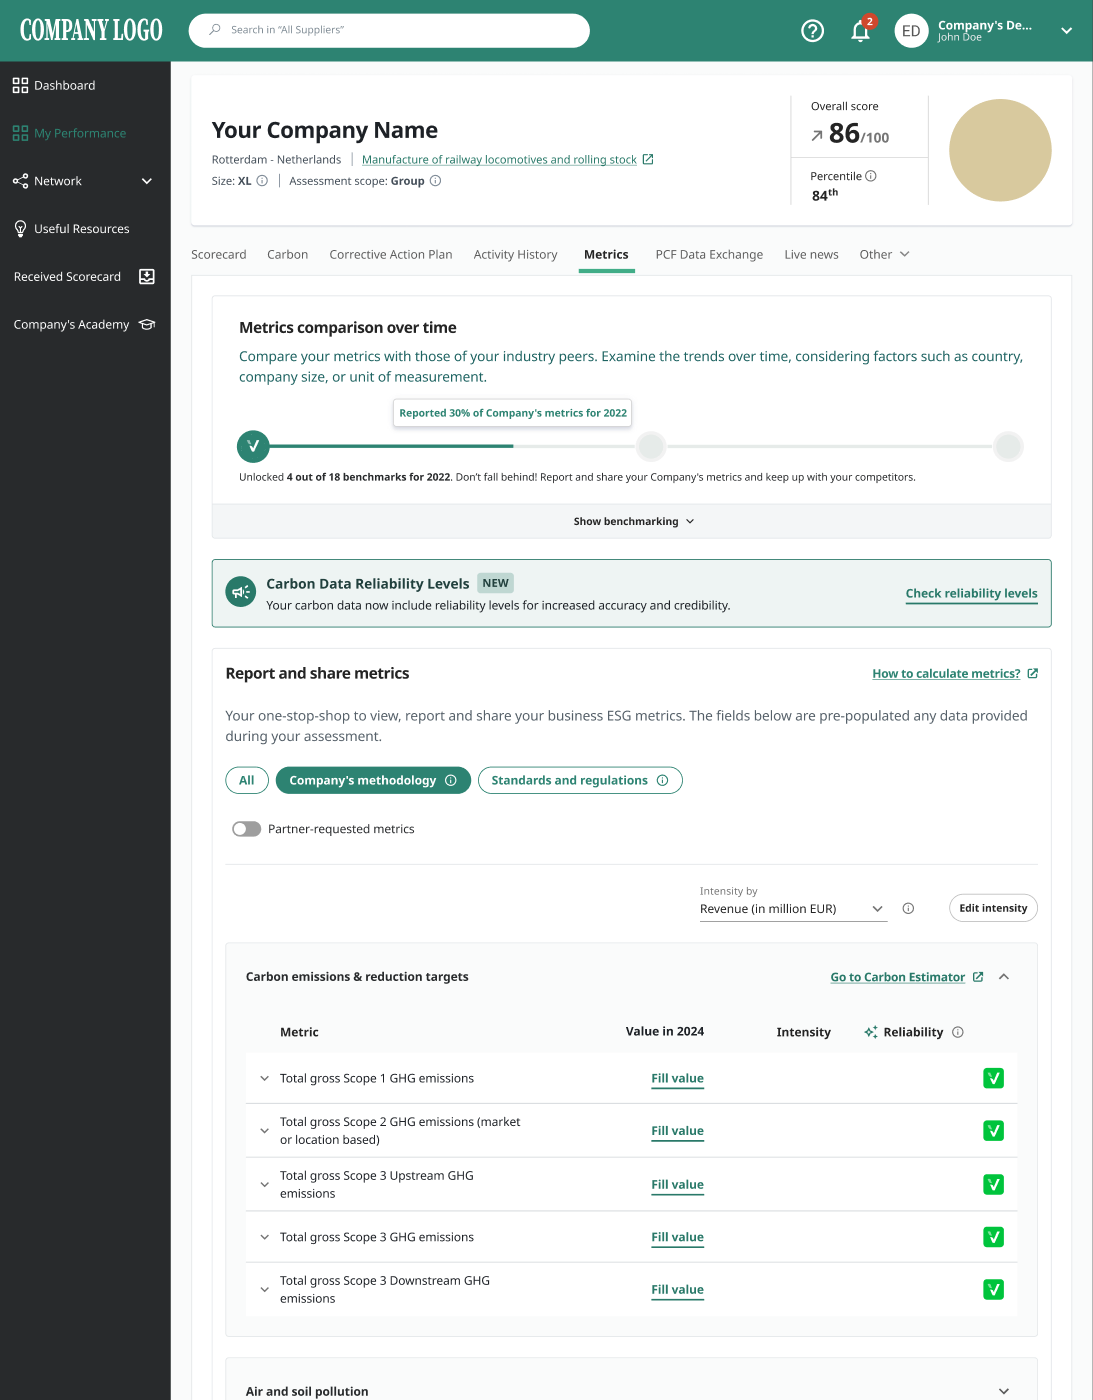
Reliability, right in the metrics view
Every carbon metric now carries a reliability tier, introduced with an in-context "NEW" banner — so suppliers meet reliability exactly where they already report their data.
05 Impact
06 Pivot
My first direction was a batch upload — drop several documents at once and let the AI prefill many data points in one go.
It tested badly. In moderated usability sessions, suppliers ignored the batch prompt entirely — and the research surfaced why: suppliers report carbon one metric at a time, not in bulk, so a bulk-first flow fought their mental model.
So we pivoted to a per-metric flow, launched straight from a specific data point. The next round of testing came back clean. The dead end wasn't wasted — it's what made the shipped design credible.
Before
Batch review — the AI prefilled data points across years and scopes in one go. Suppliers ignored the prompt to run it, and those who did were overwhelmed by reviewing everything on a single screen.
After
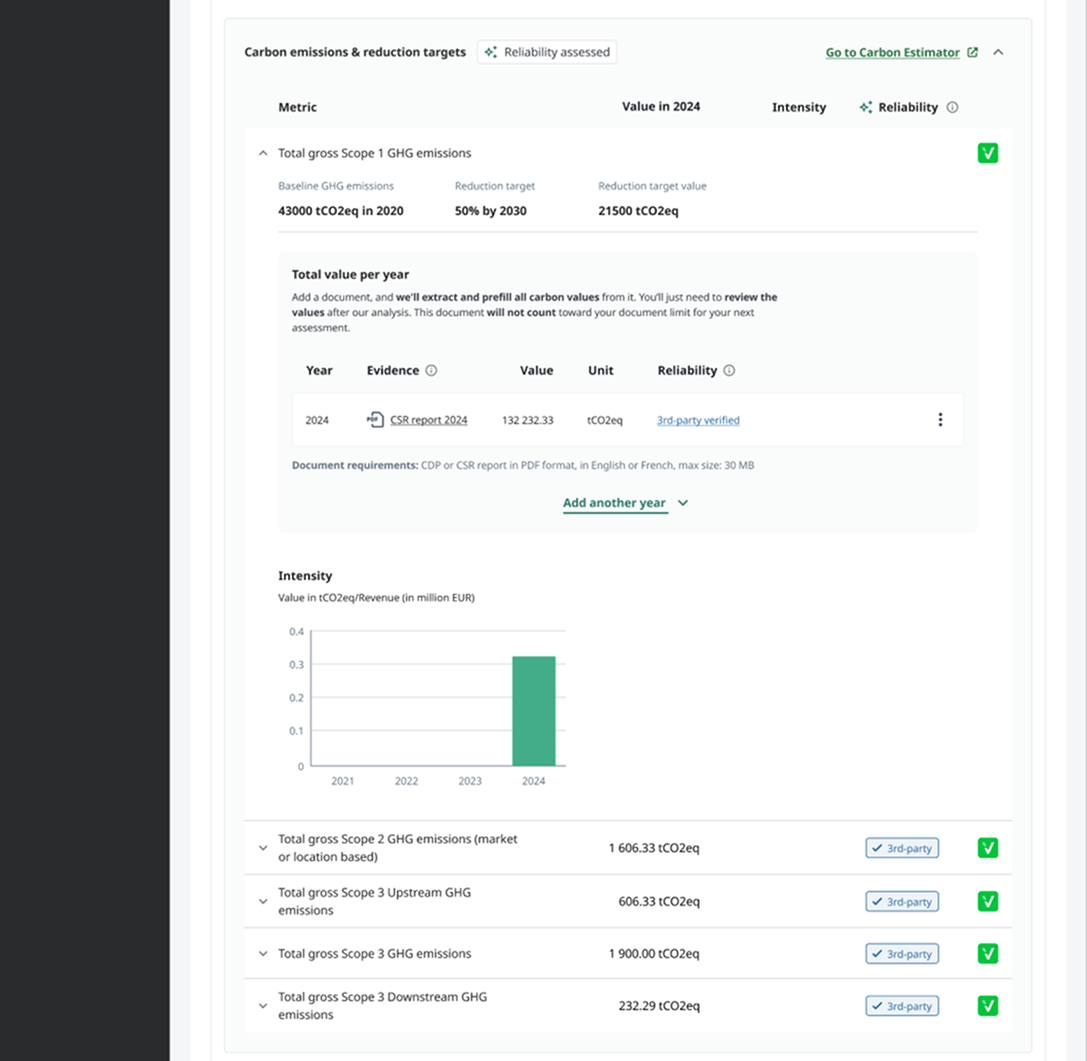
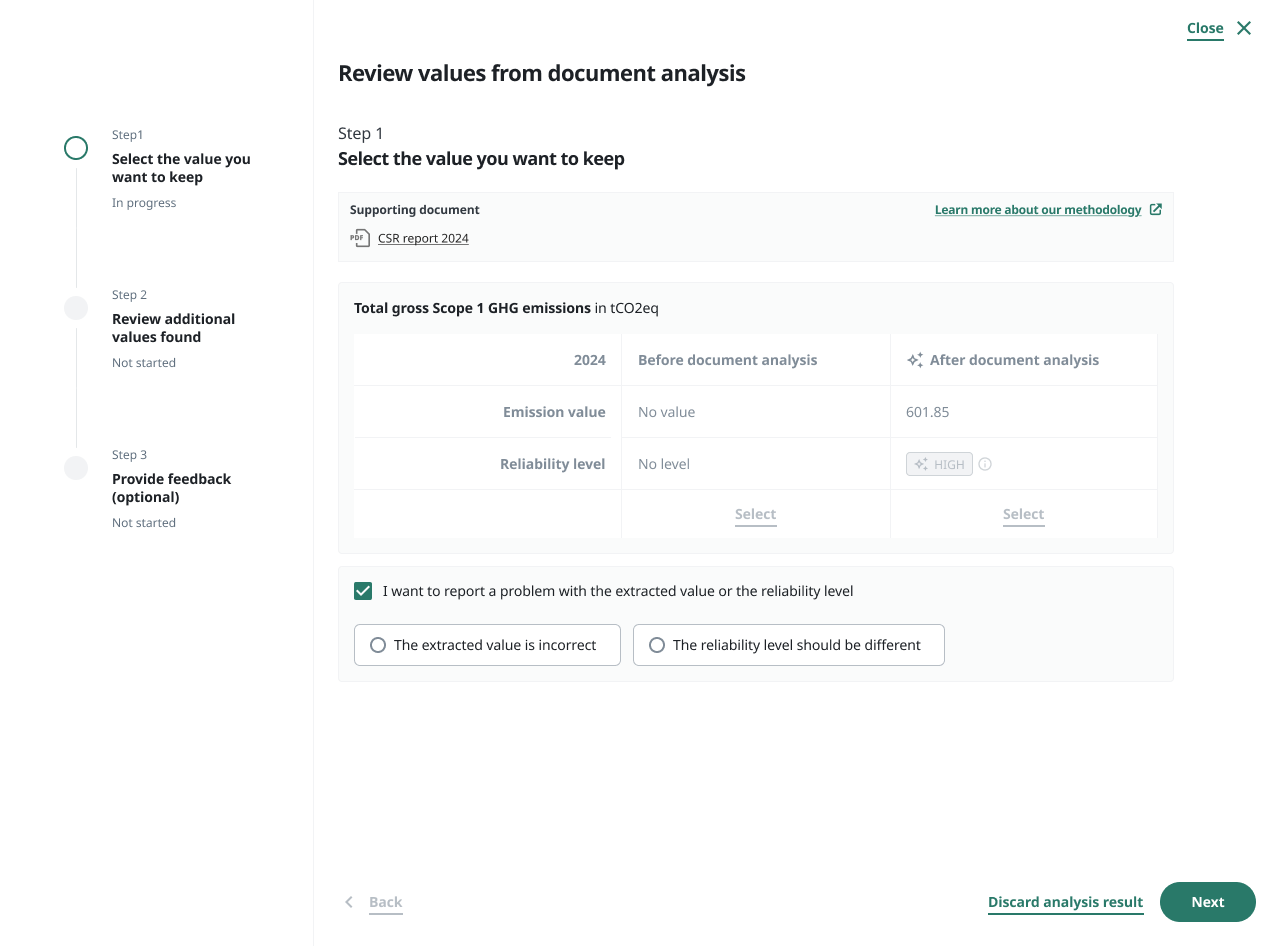
Per-metric review — one metric at a time, with an explicit before/after and a Select the supplier chooses.
07 Reflections
Designing with the AI, methodology, and engineering teams in the room from day one. Stress-testing early meant the experience never promised something the model couldn't deliver or the methodology didn't actually do.
I'd pressure-test the core mental model sooner. The batch-upload concept took a full moderated round to disprove — an earlier, cheaper concept test would have caught it before we built the flow.
Trust in AI is built as much by what an interface refuses to do automatically as by what it does — the explicit "Select", the named "Pending" state, and the always-visible escape hatch mattered more than raw accuracy.
Next Project
From Compliance to Value